
Part II-Baseline Survey of Minority Concentrated Districts-Churachandpur
- Serto Rocky Kom
- Oct 17, 2020
- 9 min read

PART II A BRIEF PROFILE OF CHURACHANDPUR 2.1 Area and Location Churachandpur district is situated in the south west part of Manipur. The district is bounded by Senapati district in the north, Bishnupur and Chandel districts in the east, Assam and Mizoram in the west and Myanmar on the south. The total geographical area of Churachandpur district is 4,570 sq.km. It lies between 23º 55'N and 24º 30'N Latitudes and between 92º 59'E to 93º 50'E longitudes. The topography of the district is hilly. The district got its name “Churachandpur” from the Manipur king Churachand Maharaja. It is home to 2, 23,866 people, as per 2001 census, dominated by 15 ethnic groups like the Chin, Kuki, Mizo, Naga and Zomi.
2.2 Administrative Division

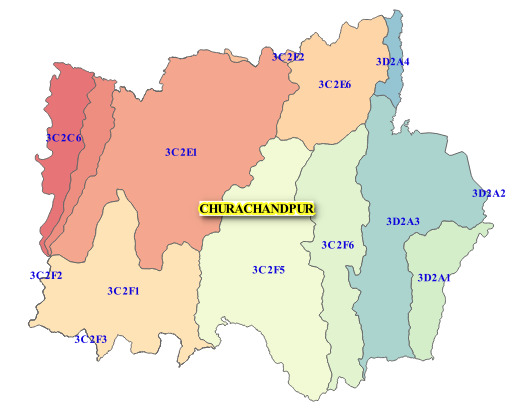
The district is divided into 5 revenue sun-divisions, namely Churachandpur, Singnat, Thanlon, Parbung (Tipaimukh) and Henglep. There are 6 Tribal Development Blocks except for Churachandpur sub-division where there are two Blocks namely Churachandpur and Samulamlan. The sub-division officer also functions as the Block Development Officer and they are the main implementing agencies for the schemes undertaken under the DRDA such as EAS, JGSY etc. Administrative Divisions No. of units
Sub-divisions 5 Tribal Development Blocks 6 Village Authority 612 Sub-Deputy Collector Centre 9 Vidhan Sabha Seats 6 District Council Seats 20 2.3 Resource Base 2.3.1 Population As per the census 2001, the district has total population of 227905 which constitute 10.52% of the total state population. The density of population per sq km is 50. The schedule tribe and schedule caste population form the 93.2 percent and 0.9 percent of the total population respectively. Table 2.1 Total population by major religious groups in Churachandpur district Religion Person Hindu 10538 (4.62) Muslim 2573 (1.13) Christians 213186 (93.54) Total population 227905 Source: census of India 2001. Note: Figures in brackets are p.c. to total
The overwhelming majority of the tribal population is Christians. The decadal variation of population growth rate shows a declining trend- from 37.41 percent in 1971-81 the growth rate of population decreased to 30.71 percent in 1981-91. During 1991-2001 the growth rate decreased further and stood at 29.34 percent. 2.3.2. Sex Ratio As per the Census 2001 estimates, Churachandpur district has the second highest sex- ratio of 944 female per 1000 males among the districts in Manipur. However, the sex ratio for the Hindus is abysmally low. The sex ratio of the SC population in the district is 433 females per thousand males while the same for ST is 966. This shows that Majority of the SCs who are Hindus have low sex ratio. Table 2.2 Sex-ratio by religion in Churachandpur district Religion Sex ratio (females per ‘000 males) All religion 944 Hindu 369 Muslims 728 Christians 987 Source: census of India 2001. 2.3.3. Literacy Rate The literacy rate in the district as per the estimates of Census 2001 is 70.6 percent. The male and female literacy rates in the district are 77.7 percent and 63.1 percent respectively. Table 2.3 Literacy rate by religious group in Churachandpur district Religion Literacy rate
Total Male Female
Hindu 80.50 88.48 58.33 Muslim 65.72 75.67 52.06 Christians 70.11 76.84 63.30 Source: Census of India 2001. Religion wise literacy status reveals that Hindus have the highest literacy rate. However gender segregated figures show that female literacy rate in the district is much lower than the male literacy rate. 2.3.4 Workforce The workforce distribution of the total population in the district shows that 43.60 percent of the population is in the total workforce. Cultivators comprise the major work rural force in the district. Other workers category which includes services in tertiary sector is the next major work. While majority of Muslims and Christians are engaged as cultivators, proportionately more Hindus are engaged in tertiary sector. The WPR among the Hindus is also highest among the major religious groups in the district.
Table 2.4 Proportion of different groups of workers by religious groups Religion Total worker. Cultivators. Agricultural worker. Household industrial worker. Others. Non- worker All religion 99363 56107 8472 7043 27741 128542 All religion 43.60* 56 9 7 28 56.40* Hindus 62 12 3 4 81 38 Muslim 49 49 4 6 41 51 Christians 43 60 9 7 24 57 Note: * is the P.C. to total population. Source: Census of India 2001 The male female WPR shows that, female workers ration is much lower than the males. The data shows that although Hindu males have high WPR, the corresponding ratio for females is only 9 percent which shows that female work opportunities are highly restricted. Low sex ratio coupled with low WPR among the Hindu females reflects high gender disparity among the Hindus.
2.3.5 Education and Health Education Although the Census 2001 data shows that 70 percent of the population in Churachandpur district is literates, the level of educational attainment is skewed towards lower end. Approximately 24 percent of the population has below primary level education, while only 28 percent have completed primary level; the proportion of population with middle level schooling is 21 percent. Proportion of the literate population completing their matric/higher secondary/diploma is 22% and a mere 5 percent are graduates or above. Table 2.7 Gross and Net Enrolment Ratio in Churachanpurbdistrict-2005-06 School level Total population 6-11 years GER NER Boys Girls Total Boys Girls Total Boys Girls Total
Primary 17356 16687 34043 89 86 87 66 64 65 Upper
Primary Total population 11-14 years 12141 11727 23868 39 35 37 33 31 32 Source: Govt. of Manipur, Education Department. The GER/NER data clearly reveals high incidence of drop outs from primary to upper primary level. The NER at the upper primary level is less than half the ratio at the primary level. Further, the NER for girls is lower than the boys shows that drop out rate among girls is higher in the district. Table 2.8 Number of educational institution in Churachandpur district 2001-02(P) Types of institution Number of institutions Pre-primary/primary/JB/UJB school 270 Middle/Jr.high/sr.Basic school 102 High/Higher Sc. School 79 Professional&other educational school 6 Colleges for general education 6 Professional&other educational colleges 1 Universities Nil All institutions 464 Source: Statistical Abstract Manipur 2005. Table 2.9 Number of teachers by type of institution in Churachandpur district Types of institution Number of teachers Pre-primary/primary/JB/UJB school 727 Middle/Jr.High/Sr.Basic school 1035 High/ Hr Sc. School 1763 Professional& other educational school 37 Source: Statistical Abstract Manipur 2005.
Health An important indicator of health status of the people is the life expectancy at birth. The life expectancy at birth in the district stands at 57.50. The male life expectancy is 54.90 while the female life expectancy is estimated to be much higher at 61.10. The AIDS has become a major public health problem in Manipur since 1990. Maximum number of positive cases is found in the age group of 21-30 years. As per the Sero- Survillence report on 31st March 2005, a total of 3026 blood samples were screened of which 33.01 percent were found to be HIV positive cases. The district has the third highest incidence of HIV positive cases in the State. The other types of diseases which have higher frequency of occurrence are heart ailments, malaria and chronic liver disease. The incidence of complications at birth and pueperium is found to be more among rural women in the district. Another important indicator for health status is the child sex ratio. The child sex ratio in the district is 968. The high child sex ratio among the Muslims reflects higher fertility rate and higher survival ratio for children in the age group 0f -6 years. Table 2.10 Child sex-ratio by religion in Churachandpur district Religion Total All religion 968 Hindu 968 Muslim 1093 Christians 967 Source:Census of India 2001. The major health service in the district has been provided through a network of two private and one government hospital. The district has a total of 48 PHSC with population coverage of 4748 persons per PHSC. The number of doctors per lakh population is 0.71 as per Manipur HDR, 2001. 2.3.7 Natural Resource Base Land and its Utilization As per the 1994-95 satellite imagery, the total built up area of Churachandpur district is 6,726 Ha. (Urban - 585 Ha. and Rural - 6,141 Ha.) and the cropland area is 9,928 Ha. A large portion of the area is either under current jhum (29,323 Ha) or abandoned jhum (190,447 Ha) respectively. There is no primary forest in the district and the secondary forest including mixed bamboo forest, covers an area of 118,092 Ha. The area under wasteland is 98,424 ha and the total area of the water bodies is 2,144 Ha.(2,072 Ha. of river/streams and 72 lakes/tanks/ponds). Due to population pressure Jhum cycle has reduced from 5-7 years to 4-5 years. The total forest cover in the district is 88.99 percent as per the State Forest Report, 2005.
Soil and Water The district has maximum temperature of 37°C while minimum is 10°C. The highest rainfall is 3080mm and the lowest is 597mm. The major river flowing in the district is Leimatak, Leinganpokpi, Barak River, Khuga and Tuitha. Table 2.11 Ground water resource potential in Churachandpur district (MCM) Ground water Utilizable ground Utilizable ground
resource dynamic water for irrigation. water for drinking & allied 756.80 643.28 113.52 Source: www.manipur.nic.in Economy Churachandpur mainly follows a mono-crop economy during the non-monsoon months. Apart from agriculture, handloom and handicraft and weaving provide the livelihood of the people. The handloom and handicraft especially acrylic is an important out put of the handicraft sector in the district. The district has a total of 39294 numbers of weavers, using 43847 number of loom. The consumption of yarn per month is estimated to be 56502.10 kg, producing 361953.60 meter cloth. The main handloom products include Acrylic/ wool cloth like, tribal Shawl, ladies lungies, wall hanging and covering, upholstery, hanging bags, curtain, home furnishing etc. The silk handicraft in the district is small in size. The sericulture activities are centered round 14 farms and mulberry is the major product in the district although some amount of eri and tasar are also produced. Table 2.12 Status of sericulture in Churachandpur district in 2004-05 No. Cocoon production Value(in lakh) of farms Mulberry(MT) Eri(MT) Tasar(MT) Mulberry Eri Tasar 14 20 10 0.06 20.00 8.00 0.48 Source: Economic Survey Manipur 2007-08. The proportion of livestock in the district is 7.04 percent of the State total. The total poultry population in the district is 6.20 percent. The district has a total of 6005 enterprises (excluding crop production and plantation). The district accounts for highest annual average growth rate of establishment (13.11 percent) during 1998-2005 with annual average growth rate in employment of 8.95 percent as per the Economic Survey report of Manipur 2007-08. The economic status of the households in the district as per the latest records of the Food and Civil Supplies Department, Govt. of Manipur, 29.95 percent of the households are BPL families and there are 168 PDS in the district to cater to these households.
2.3.8 Power and rural electrification The total installed capacity of power in the district is 0.448 MW and percentages of villages electrified till March 2007 stands at 77.03 percent. 2.3.9 Transport and Communication Road is the most important means of transport in hill districts of Manipur. The condition of the road in hills districts are worse compared to that in the valley. Most of the villages are not well connected and whatever road they have cannot be used all round the year. Table 2.13 Proportion of roads under different categories in Churachandpur district National State Major district Other district Inter village Total highway highway road road road 100.00 90.0 39.51 100.00 4.42 58.69 Source: http://manipur.nic.in Large portion of inter village road are not surfaced in the district In Churachandpur district, goods are transported from Jiribam to the southernmost sub-division of Tipaimukh mainly on the river Barak. Under PMGRSY Phase V 3240.84 lakh amount was sanctioned for the construction and up gradation of the roads in the district. A total of 10 new roads are to be constructed under PMGSY with an estimated cost of Rs.3240.84 In respect of telecommunication, Churachandpur district one telegraph office, 4 telephone exchanges, 3869 telephone working (DEL). The tele density in the district is 1.70. Table 2.14 Average Consumption of power by different users Type of users Average consumption Domestic 64.3 Commercial 8.71 Industry 8.14 Public lighting 1.21 Irrigation& agriculture 0.00 Public water work 0.60 Temporary 0.00 Bulk supply 17.02 Total 5.45 Percentage of state total 3.08 Source: http://manipur.nic.in 2.3.10. Basic Amenities As per the 2001 census, Churachandpur district has 37,626 numbers of households. There are only 6.4 percent households who have permanent houses, 39 percent have
semi-permanent houses and 54.6 percent have temporary houses. Safe drinking water facilities and electricity are available in 29.82 percent villages. While 73 percent of the villages have a primary school, middle level schools are available in only 27 percent of the villages. Medical facilities are available in 12 percent of the villages and one PHSC in the district covers a population of 11 villages which clearly indicates the status of health infrastructure in the district. The connectivity status in the district reveals that only 18 percent of the villages have bus connectivity while 48 percent of the villages have no approach roads. Table 2.15 Basic amenities in Churachandpur district Amenities Numbers Total inhabited villages 540 Drinking water facilities 539 Safe drinking water 161 Electricity(power supply) 306 Electricity(domestic) 306 Electricity(agriculture) - Primary school 395 Middle school 143 Secondary/Higher secondary school 48 College 5 Medical facilities 66 Primary health centre 7
Primary health sub-centre 48 Post, telegraph and telephone facility 67 Bus service 95 Paved approach road 123 Mud approach road 279 Source: www.censusindia.gov.in A causal analysis of the development deficiencies in the rural areas of the district reveals that three major deficits in the rural areas are: education, health, safe drinking water, transport and communication and industry and tertiary sector employment. The deficits need critical intervention for synergizing the growth process in the district. ■
Courtesy. Serto Rocky Kom
Like & Share


Comments